Internal Research
In the preparation phase, you will focus on gathering data from within your company, analyzing it, and building up a framework for the subsequent steps. The preparation phase requires analytical skill in order to handpick useful information from the company’s systems.
To review the strategic sourcing definition from CIPS, the purpose of strategic sourcing is to satisfy business needs for predefined materials and services. Of course, every business has many different needs, and you cannot do everything at the same time. This is why in step one you will have to make choices and define your list of priorities and scope of work.
There are six parts to internal data research:
1 Categorization
2 Category risk analysis
3 Scope selection
4 Spend analysis
5 Cost structure analysis
6 Total cost of ownership

1. Categorization
Categorization in the supply chain is a key element when defining a category manager’s scope of work. There are different ways to categorize spend in a company. Some simple examples of high-level spend categorization are direct/indirect, materials/services, domestic/import, critical/noncritical, ABC, etc. However, these categories are simply too broad to draw meaningful conclusions, and we have to go deeper into the details.
Fig. 1 – A sample spend categorization
Every company should have their own spend categorization structure, and it should be maintained in the ERP material master. If the company has not created categorization in the ERP material master, it should still have spend separated into different cost accounts. Usually Accounting is responsible for separating spend into different cost categories. If your company has no master data available, check with Accounting first to see if you can use their spend data as a starting point.
When building up a categorization structure from scratch, make sure you include your entire team in the process. You may also find it helpful to team up with Engineering and Design in order to find the answers to some of your more technical questions. Build up a category tree by starting at the highest level and then moving down to the details. How many levels you want to go down and how detailed you want to go is up to the company’s profile. In Fig.1 you will find an example of high level categorization for a typical production company that produces machines.
Categorization should be done with the long view in mind; it should not be changed often. Otherwise, if you change your categories frequently, you will not be able to compare category spend between periods.
2. Category risk analysis
When you are done with categorization, you can start to analyze the data. Use the Kraljic portfolio matrix (Fig. 2) to help you define a risk level for each category and its impact on company performance. The Kraljic model is a four-quadrant (strategic, bottleneck, leverage, and noncritical) matrix with one axis for supply risk and another for profit impact.
Fig. 2 – Kraljic portfolio matrix
Imagine each of your categories as a basket filled with products. One by one, take each of those “baskets” and place it on the Kraljic matrix. This will help you define which categories can be labelled strategic, bottleneck, leverage, and noncritical. Later on in Step 2 we will drill into each category and evaluate the risk level of suppliers in Category C.
If you’re not familiar with the Kraljic matrix, there are lot of materials available online. Check out a few of them here and here. (I recommended taking some time to learn about this matrix since the Kralijc model will be used in several steps of strategic sourcing.)
3. Scope selection
It is important to select a feasible scope. Selecting a category level that’s too high may put you in a situation where very few or no suppliers can cover your category need. In cases where you have one highly critical component, you can define this one component as your scope of sourcing work. However, if you select a single product as your category, you may spend a lot of time and energy executing your sourcing strategy for every single product. The sweet spot lies somewhere in between.
It takes experience to select a proper categorization level. Work with your team on scope selection; you should not define category scope alone.
4. Spend analysis
A spend analysis requires working with historical consumption data. During the spend analysis phase, the more detailed data, the better. This is where your company’s ERP comes in because this is where your purchase records are stored. If your company is not using master data for making purchase transactions or the master data it is not maintained, then the category manager’s work will be more complicated.
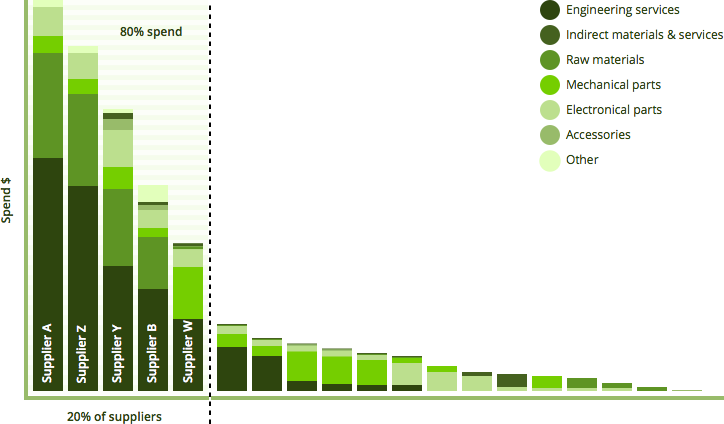
Fig. 3 – Total spend by suppliers and categories.
There are some workarounds for getting historical spend data, though. For example, you can get the suppliers’ spend data from Accounting. If you are desperate enough, you can even ask for your spend data from your suppliers. It may not look the best, but at least you will get what you need.
Once you have the data, then you can analyze it. The category manager’s best friend is Excel’s PivotTable. If you have a huge pile of data, no tool can beat it. PivotTable can be used for spend analysis since it allows you to sort and filter data in many ways and drill into the details. Ideally, PivotTable will be integrated with your company’s ERP so that you will always have access to your organization’s most recent spend data.
The spend analysis should enable you to look at the data in different ways:
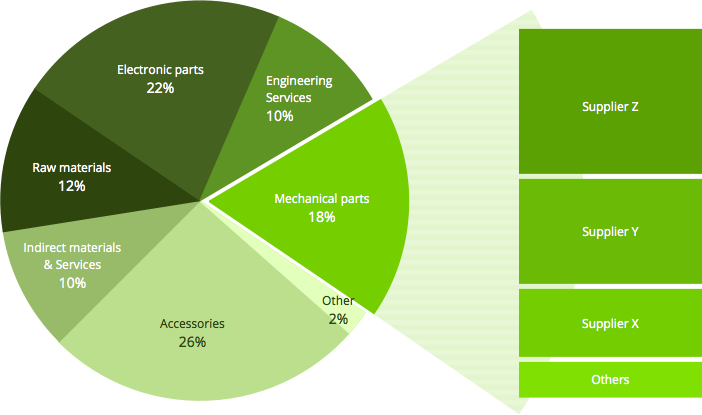
- Total spend by category and then by supplier
- Total spend by supplier and then by category
- Top suppliers with 80% of the total spend
- Category spend by supplier and then by product
- Category spend by product and then by supplier
Fig. 4 – Total spend divided by category and supplier
5. Cost structure analysis
Almost every company performs a cost analysis when calculating its own product price, but not many try to do it for purchased items. It is not an easy thing to do, and it does require some engineering skills.
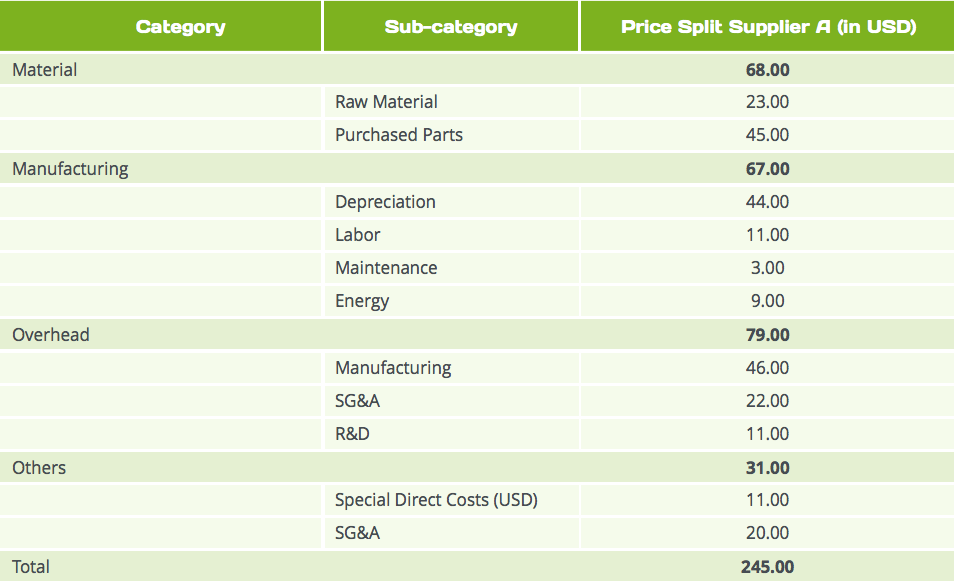
First of all, try to figure out what cost elements make up the component price your supplier offers you. Typically, for a physical product, one cost element would be raw material.
The second cost element would be machining. However, even machining can be split into different operations: punching, bending, etc. (It’s not necessary to go so deep.)
Then the next elements would be finishing, like painting and packing.
Fig. 5 – Sample cost structure template
6. Total cost of ownership
The total cost of ownership calculation is an advanced cost structure analysis where, in addition to product cost elements, other cost elements, such as acquisition (transportation, warehouse, financing cost) and lifecycle (usage period, maintenance, repair), are taken into consideration.
Prepare a TCO template (Fig. 6) and start filling it in with the data you already know. If you’re missing some data, it is not a problem since we can put those gaps on the action list.
Fig. 6 – Sample total cost of ownership template
Both the CSA and TCO are powerful tools when negotiating with suppliers because you as a buyer have an overview of different suppliers’ data when your negotiation partner has only his own.
A cost structure elements template should be used when asking for quotations through an RFQ.
Conclusions
Step one on the road to strategic sourcing is all about internal research. A category manager must be familiar with each and every category, which is why it may take one to two months before you can move on to the next step. The importance of this key preparation phase should not be underestimated, as it is the foundation for all of the other steps to strategic sourcing.
Written by Peep Tomingas


